Precision Tools for
Market Timing

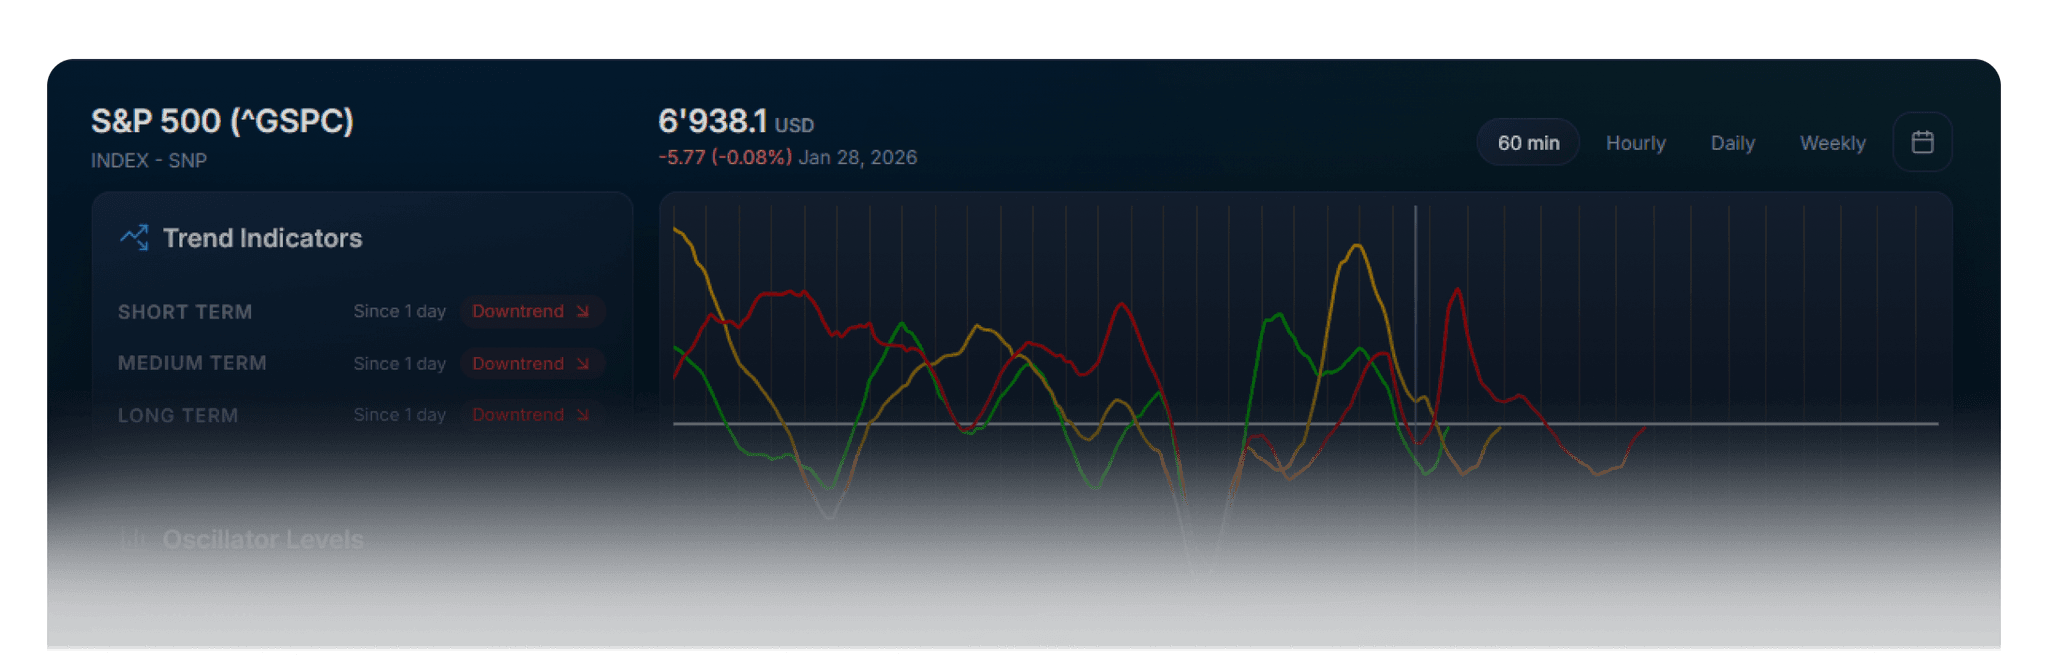
S&P 500 index dashboard showing a value of 6,938.1 USD with a slight decline of 0.08% on January 28, 2026, trend indicators all in short, medium, and long term downtrend, and a multi-line graph with yellow, red, and green lines over time.

Risk–Reward Optimization

Spot opportunities where the upside potential significantly outweighs the downside risk across weekly, daily, and hourly charts.

Learn more

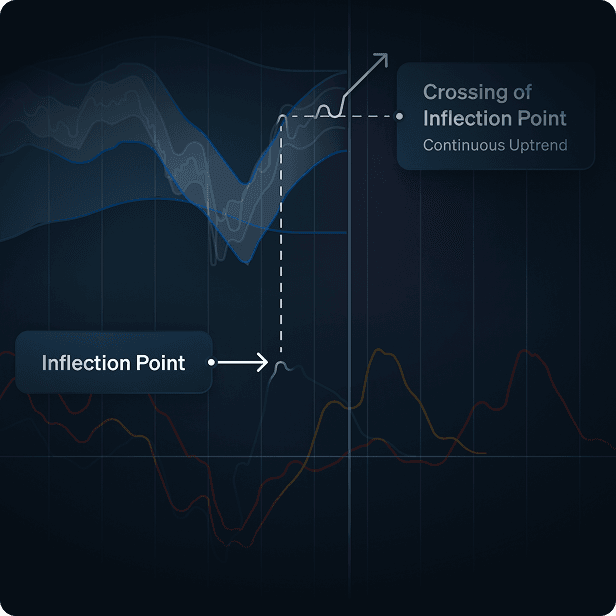
Early Trend Signals

Detect wave formation early and track trend maturity.

Dark-themed financial chart highlighting an Inflection Point with a green upward line leading to a Crossing of Inflection Point indicating continuous uptrend.

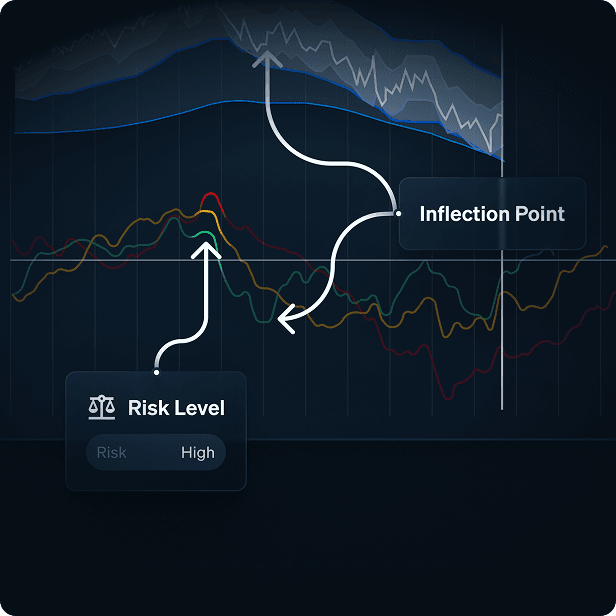
Turning Point Projection

Identify inflection zones where direction may shift.

Graph with multiple colored trend lines, highlighting a high risk level point and an inflection point.

User Experience

Experience multi-timeframe dashboards, noise filtering algorithms and clean, intuitive visuals for precise behavioral analytics.

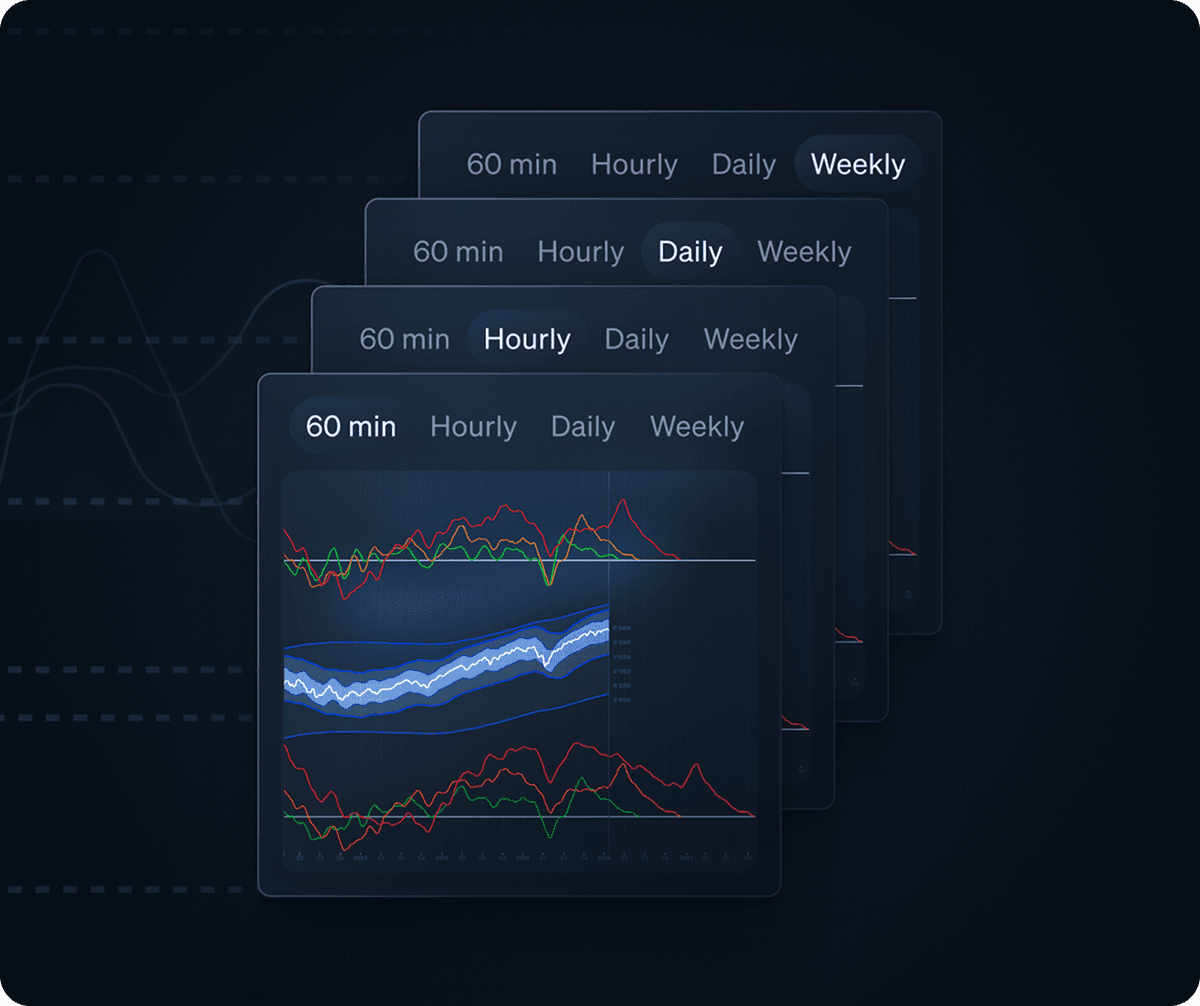
01 Multi-Timeframe Dashboard

View weekly, daily, and hourly alignment in one screen.

02 Noise Filtering Algorithms

Filter out random movements and highlight structural patterns.

03 Clean, Intuitive Visuals

No clutter. No over complication. Just clarity.

View Pricing Plans

Apply for a demo in less than a minute.

Start Today