SpectralWaves converts complex market behavior into clear, actionable insights.
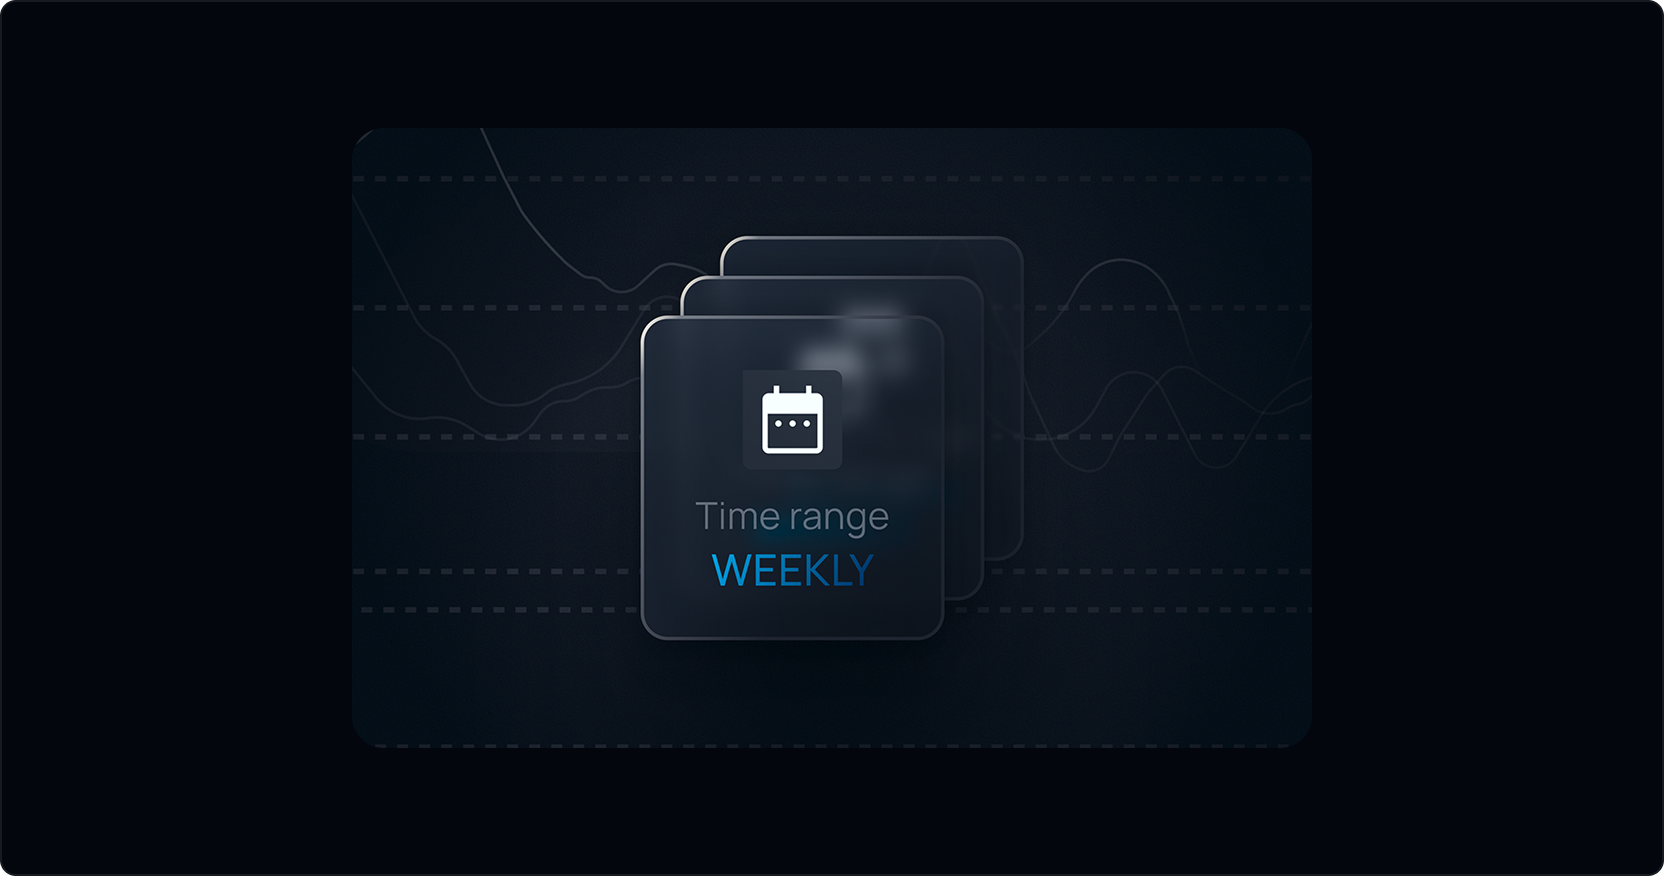
We process weekly, daily, and hourly price data to create multi-layered market maps.
• Identifies long-, mid-, and short-term structures
• Detects wave alignments
• Tracks trend maturity and price compression zones
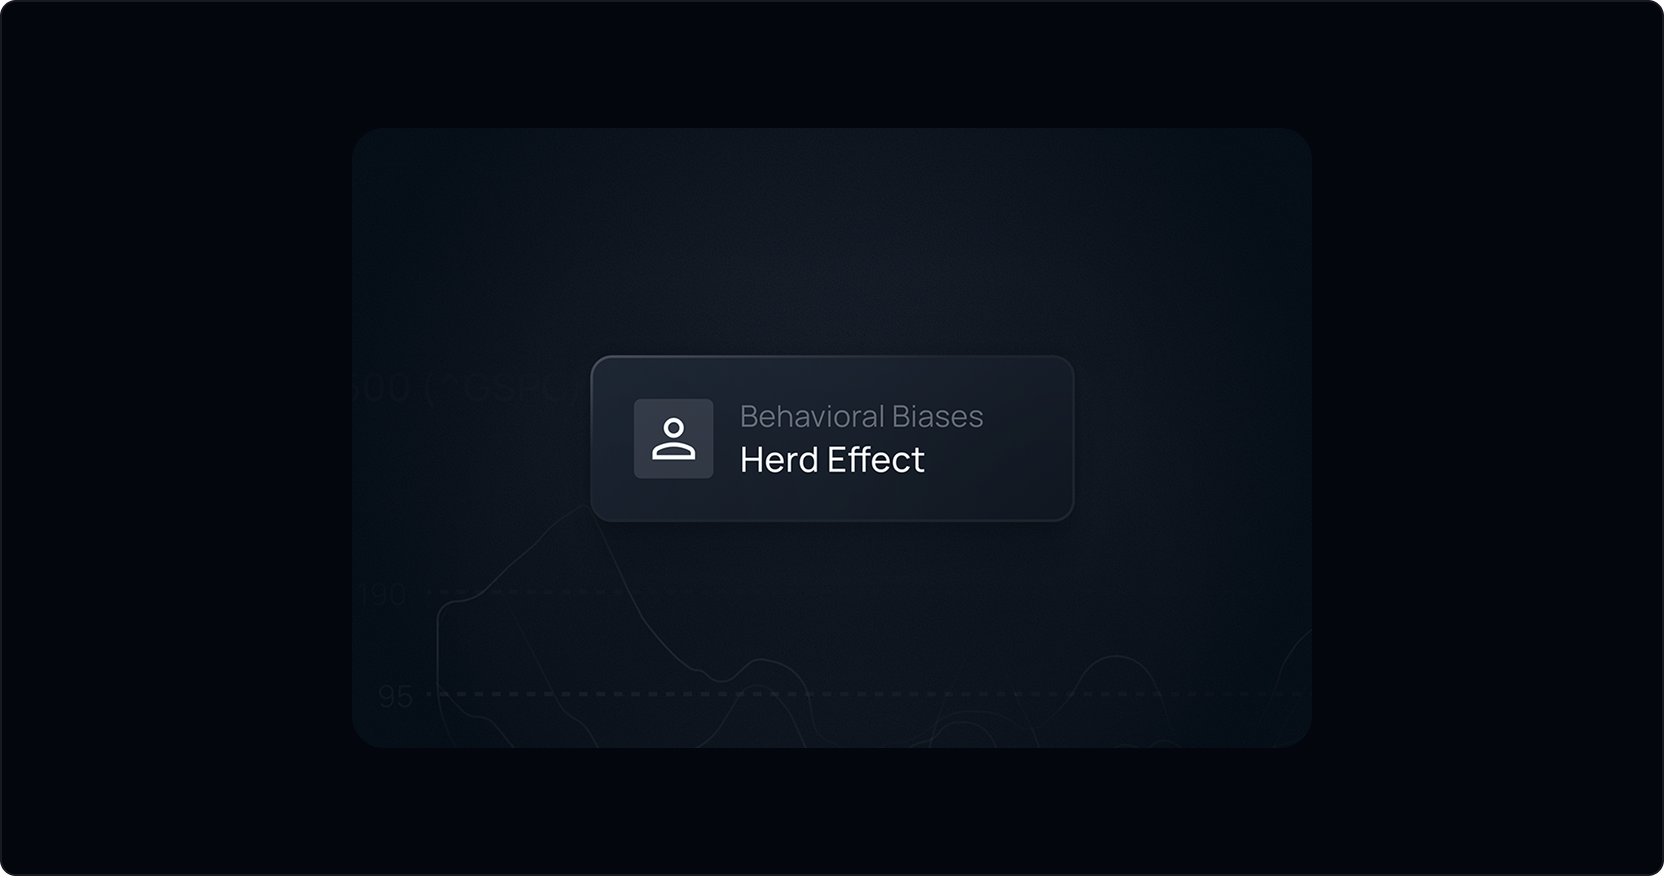
We analyze patterns linked to investor psychology:
• Herd behavior
• Momentum acceleration
• Emotional overreactions
• Confirmation bias feedback loops
These patterns amplify or weaken trend strength.
Using principles inspired by Mandelbrot’s chaos theory:
• Identify fractal clusters
• Detect bifurcation (inflection) points
• Recognize self-similarity in price waves
These nonlinear signals often precede volatility expansions.
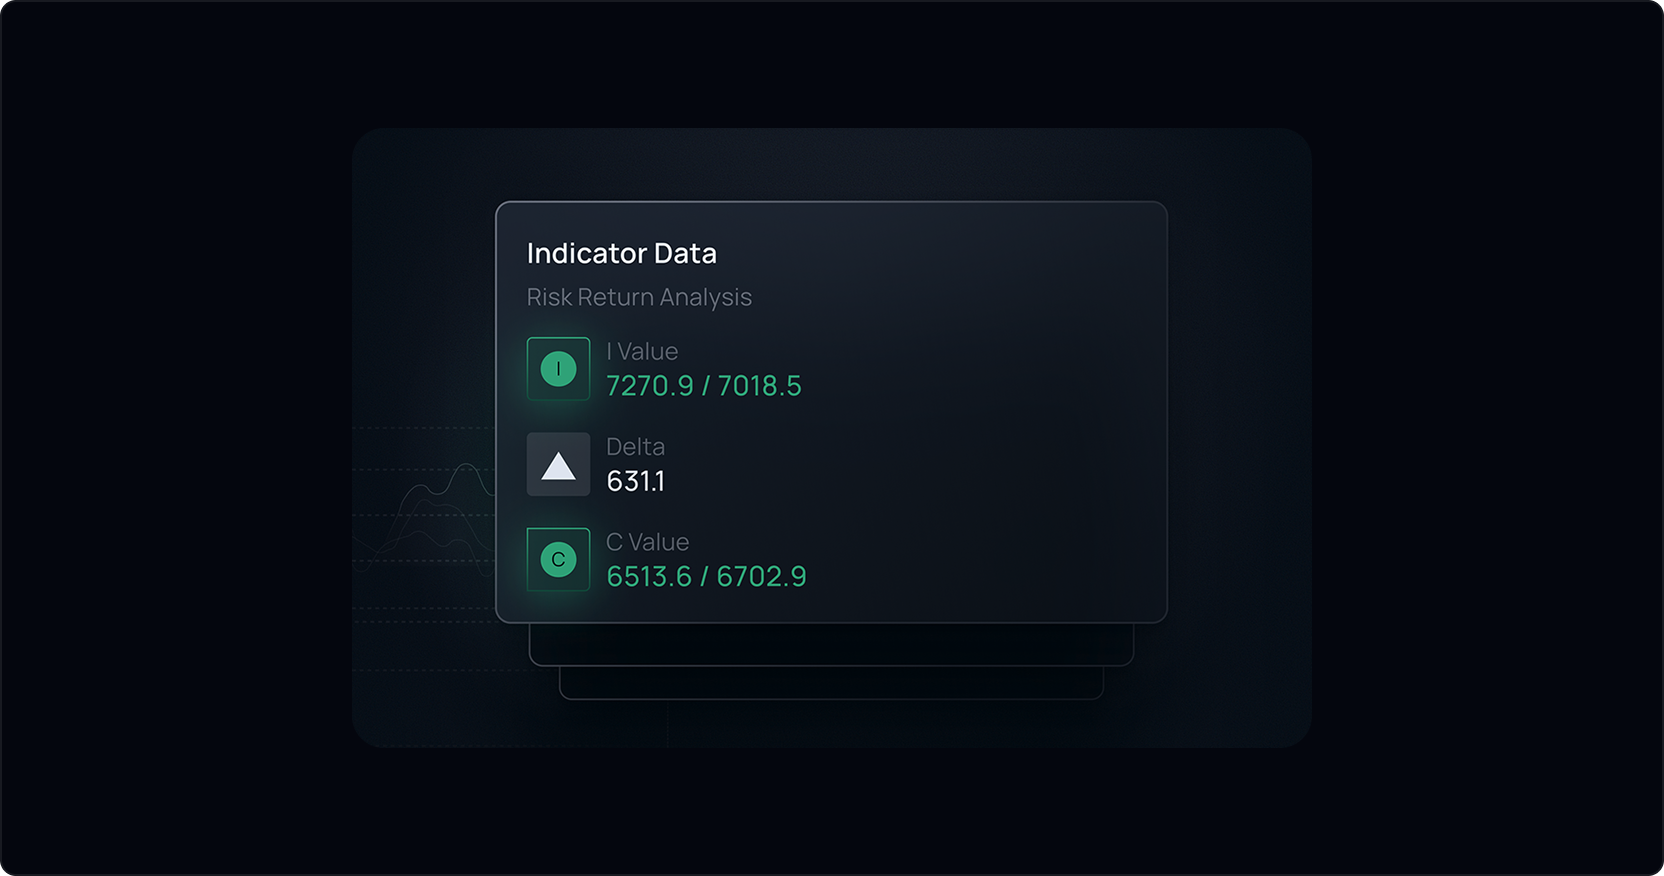
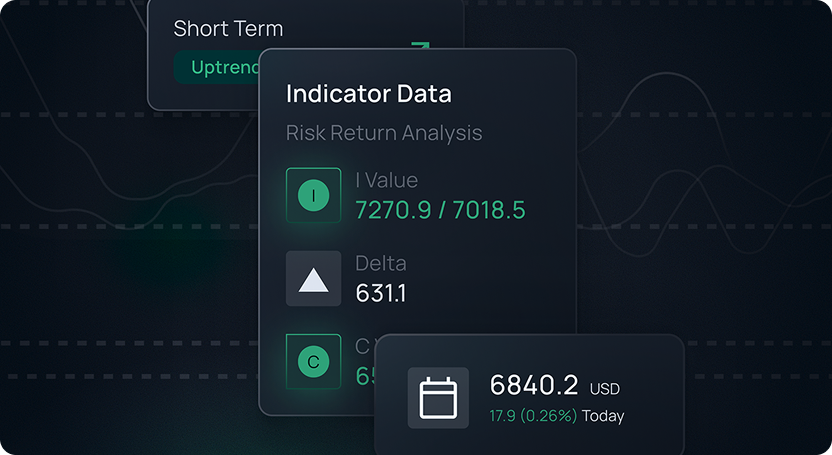
Using proprietary multi-dimensional volatility measures, SpectralWaves generates:
• Precise price target zones
• Favorable entry points
• Stop-loss / invalidation zones
• Reward-to-risk ratios
This ensures every opportunity is evaluated not just for direction, but for quality relative to risk.
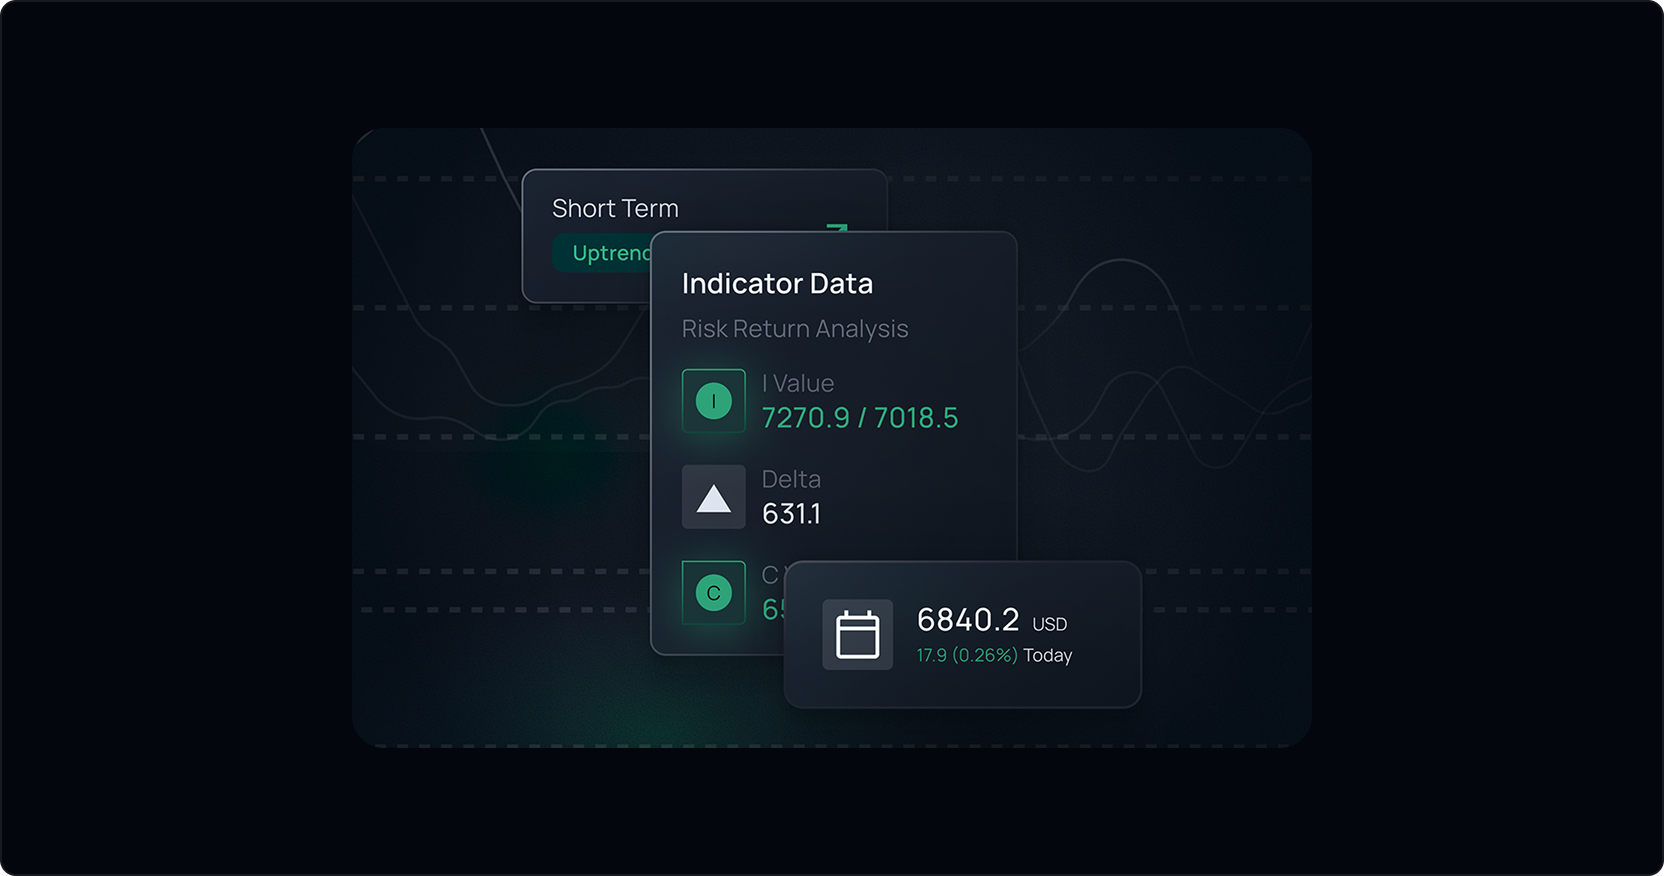
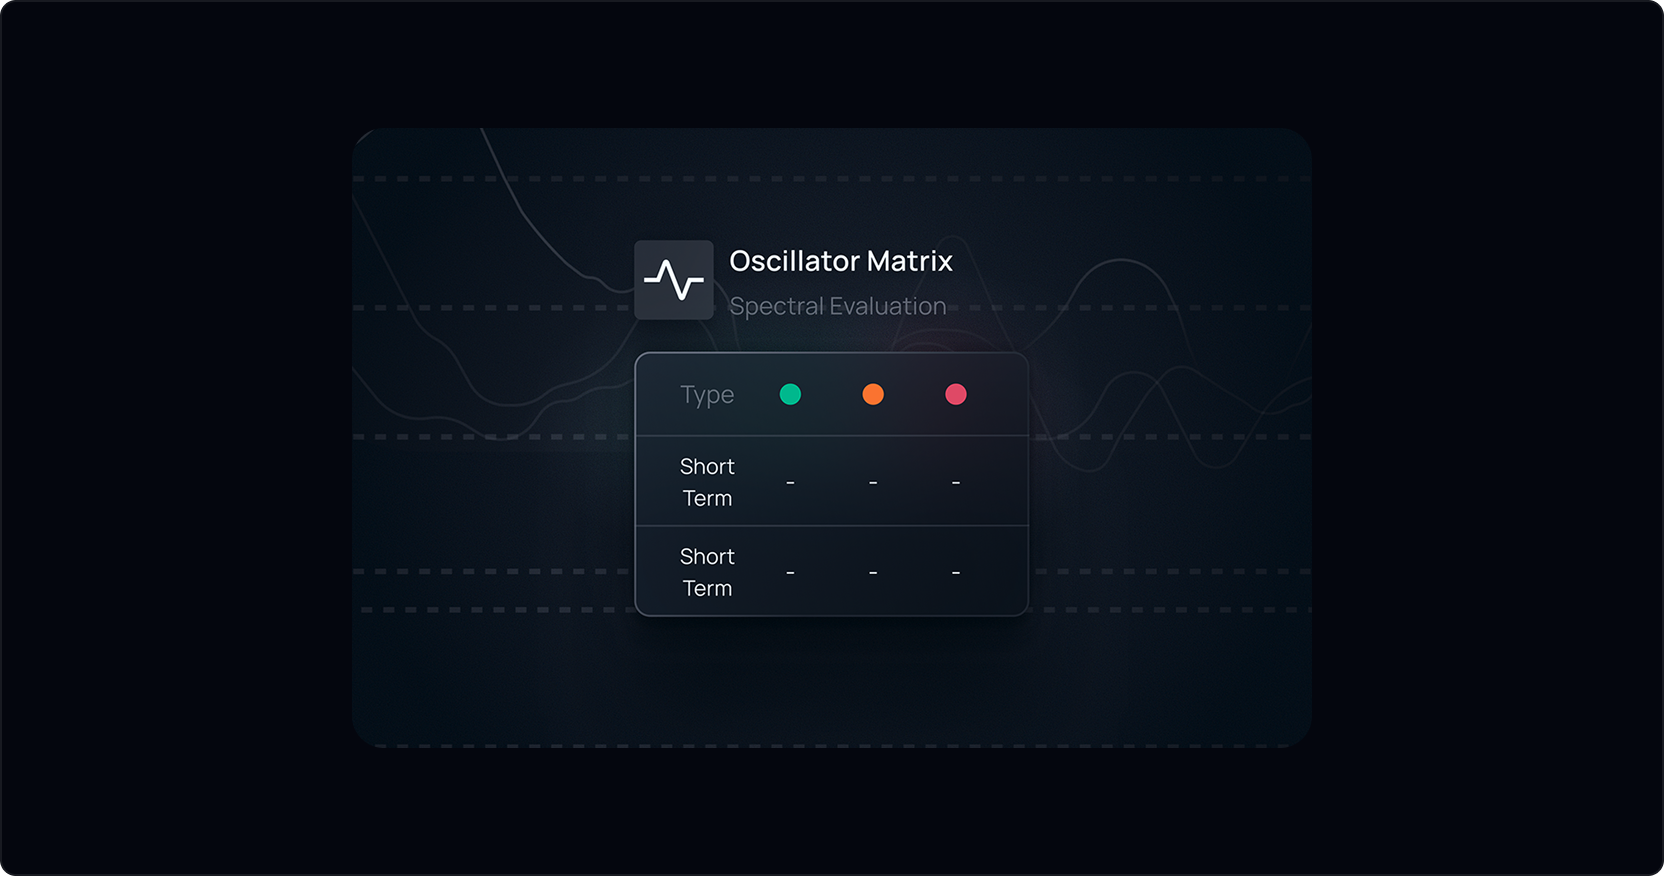
SpectralWaves presents:
• Trend direction
• Wave positioning
• Turning point projections
• Price targets
• Risk–reward ratios
• Multi-timeframe alignment
Everything is distilled into intuitive, visually clean charts.
Explore the science behind Spectral Waves.

Copyright 2026 © Spectral Waves. All rights reserved.